
Run The Numbers – Sires and buyers – The stats that point to a healthy 2026 yearling market
It was more than just an improved clearance rate on the Gold Coast, which gave strong signs of confidence in the Australian yearling market, with a record number of buyers on the sheets. Run The Numbers digs into the details.
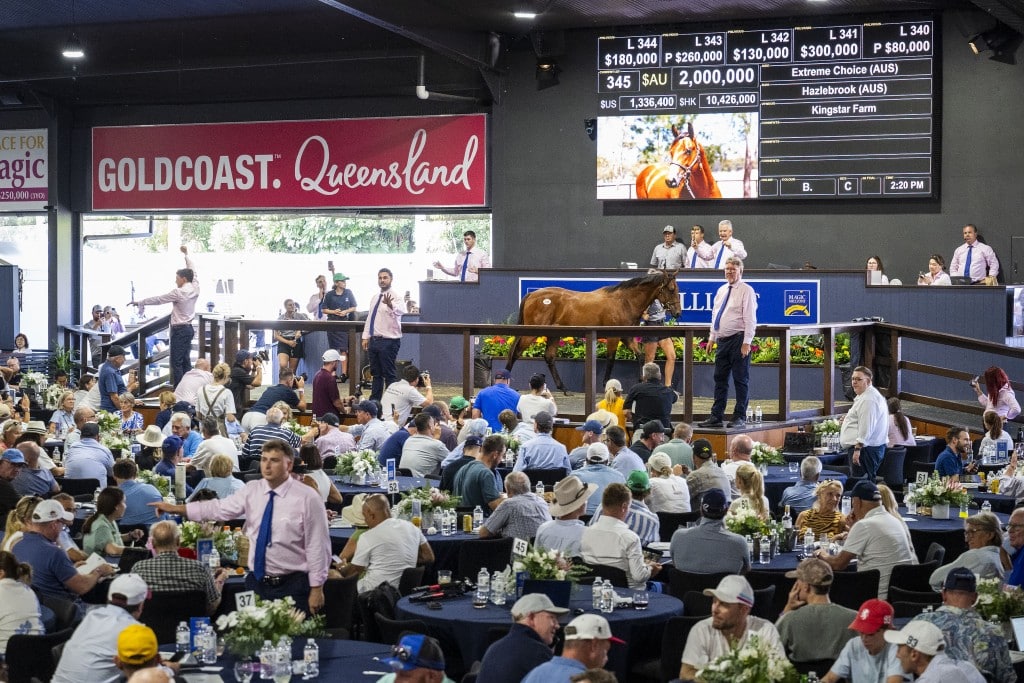
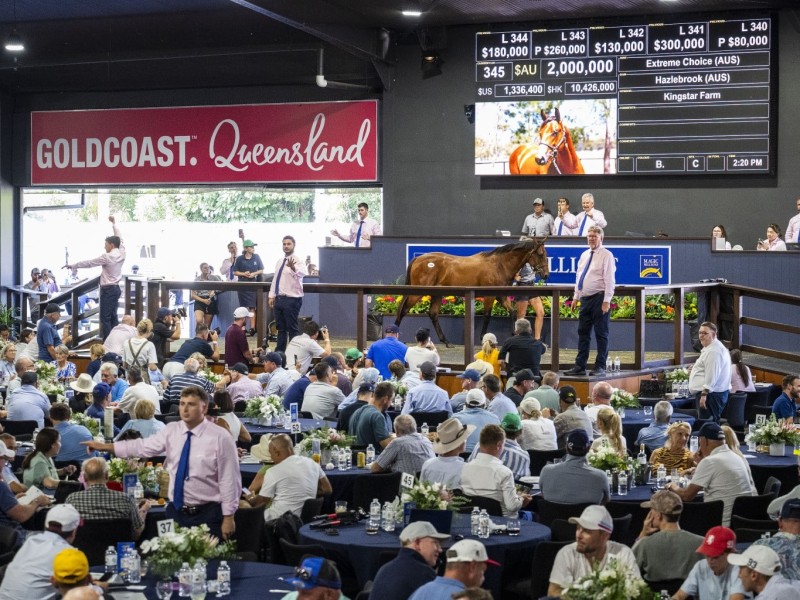
While average, median and clearance paint their own broader picture of the health of the yearling market, the raw numbers in Book 1 of the Magic Millions Gold Coast Yearling Sale give context as to what these trends mean.
Firstly, 47 fewer horses returned home with their vendors in Book 1 in 2026 than in 2025, resulting in a historically high number of pass-ins, 157.
A decision by Magic Millions to be more selective with the sale provided dividends, cutting the catalogue by 40, with the overall number of horses offered (as opposed to catalogued) down by 64 after a higher-than-expected withdrawal rate (118 compared to 95 last year).
Responding to a more selective market – 752 was the fewest number of horses sold in Book 1 since 2020 – buyers had more competition, forcing up demand.
Aggregate sales surpassed $200 million for the fifth straight year, and this figure was just $3.5 million less than 2025, across 17 fewer horses sold.
The clearance rate of 87.2 per cent was the highest in three years, arresting two years of significant declines and was above average (86.5 per cent) for this sale since 2013. Sunday’s Book 2 also featured a vastly improved clearance rate of 84 per cent, up from 73 per cent last year.
Year-by-year stats in Book 1 at Magic Millions Gold Coast
But it was the spread of sires and buyers that really demonstrated the broader depth and strength of Book 1.
Over the past three editions of Book 1 at Magic Millions, the progeny of the Top 10 sires accounted for 56.1 (2025), 53.1 (2024) and 55.7 (2023) per cent of aggregate. This year, that figure was 51.8 per cent.
There were only three sires who grossed more than $10 million, the lowest number to do so in any edition since 2020, but the number of sires with more than $1 million in sales was 44, up from 39 last year.
In other words, the spread of investment across sires was much more even.
That could also be attributed to the drop in numbers of dominant champion sires such as Snitzel, I Am Invincible and Written Tycoon, who between them had 67 horses sold, compared to 79 last year and 93 the previous year.
With fewer choices and more demand for the last-career crops of those stallions, buyers have turned their attention elsewhere.
But arguably the healthiest stat is the pure number of buyers.
There were 369 buyers who got on the sheet across the four days of the main Gold Coast sale. That is the highest number in the sale’s history.
Last year, that figure stood at 343, while in 2024 it was 363. Both of those sales featured more horses sold than this year’s edition.
The total buyer stat includes multiple instances of the same people buying in different partnerships.
Trainer Ciaron Maher, for example, was involved in 14 different buyer combinations across 43 horses, which was only one more than he was part of last year.
In an era when buyers are more selective, more and more agents, trainers, and syndicators are teaming up to pool resources. If they find themselves on the same horse, then why not split the risk?
It is an approach that no doubt frustrates vendors, who would prefer all parties to go head-to-head, but which, in theory, should lead to more horses being sold as budgets stretch further.
There were 46 individual buyers who spent more than $1 million in Book 1 this year, up from 45 last year, while 318 spent more than $100,000, a big jump from 288 last year.
While the buyer data has its flaws, it does point to greater strength in the middle buyers’ market, dominated by trainers and syndicators. And that market is a crucial indicator of the broader industry’s health.
Individual buyers per year at Magic Millions Gold Coast Book 1
Author

Related Articles
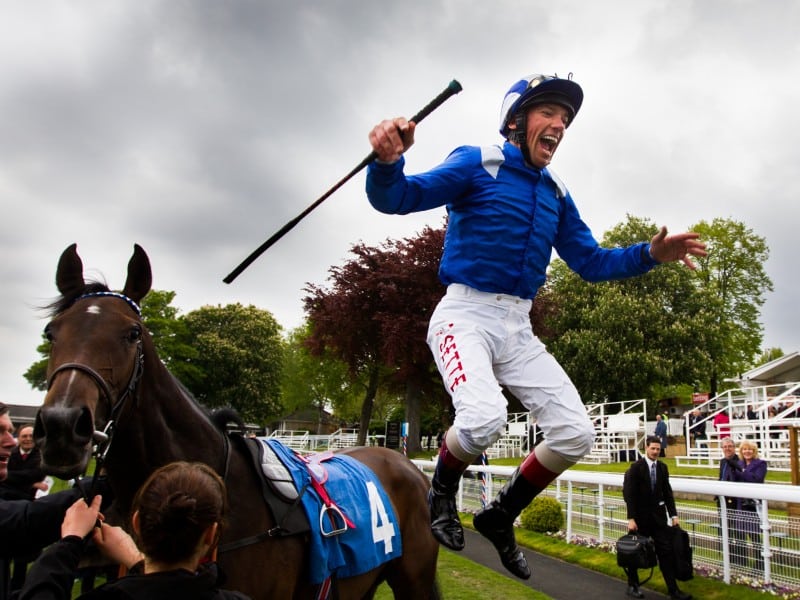
Run The Numbers – A fitting farewell for Frankie
Frankie Dettori brought his 40-year riding career to an end with a Grade 1 success on his final day in the saddle. The most prominent global jockey of the past half-century had elite success in 17 different countries, but famously never in Australia. Run The Numbers digs into his remarkable career.
Run The Numbers – The August foal premium
Buyers’ desire to source yearlings with an earlier foaling date is having a significant impact on the Australasian bloodstock market, with August foals commanding a 10 per cent premium compared to average throughout 2025. Run The Numbers digs into the details.
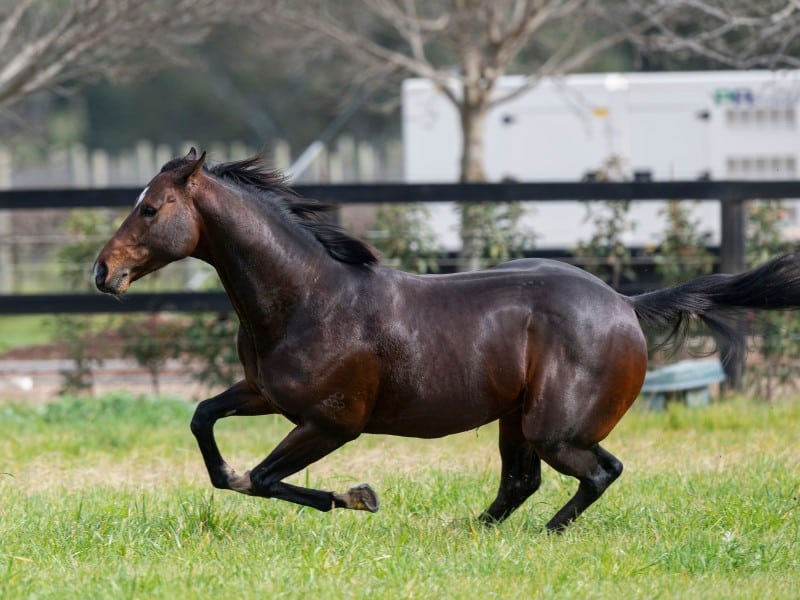
Run The Numbers – All-in on Alabama as Yulong bids to create Australia’s next superstar stallion
Recently published data revealed Yulong’s rising star Alabama Express covered no fewer than 21 Group 1-winning mares in 2025, confirming the son of Redoute’s Choice’s status as No.1 seed at Australia’s biggest breeding operation. Run The Numbers breaks down his career at stud so far.