Run The Numbers – The state(s) of the nation

The recent release of the Racing Australia Fact Book allows us to compare the role Australiaâs six states and two territories play in the national thoroughbred landscape. This weekâs Run The Numbers looks at each stateâs contribution.
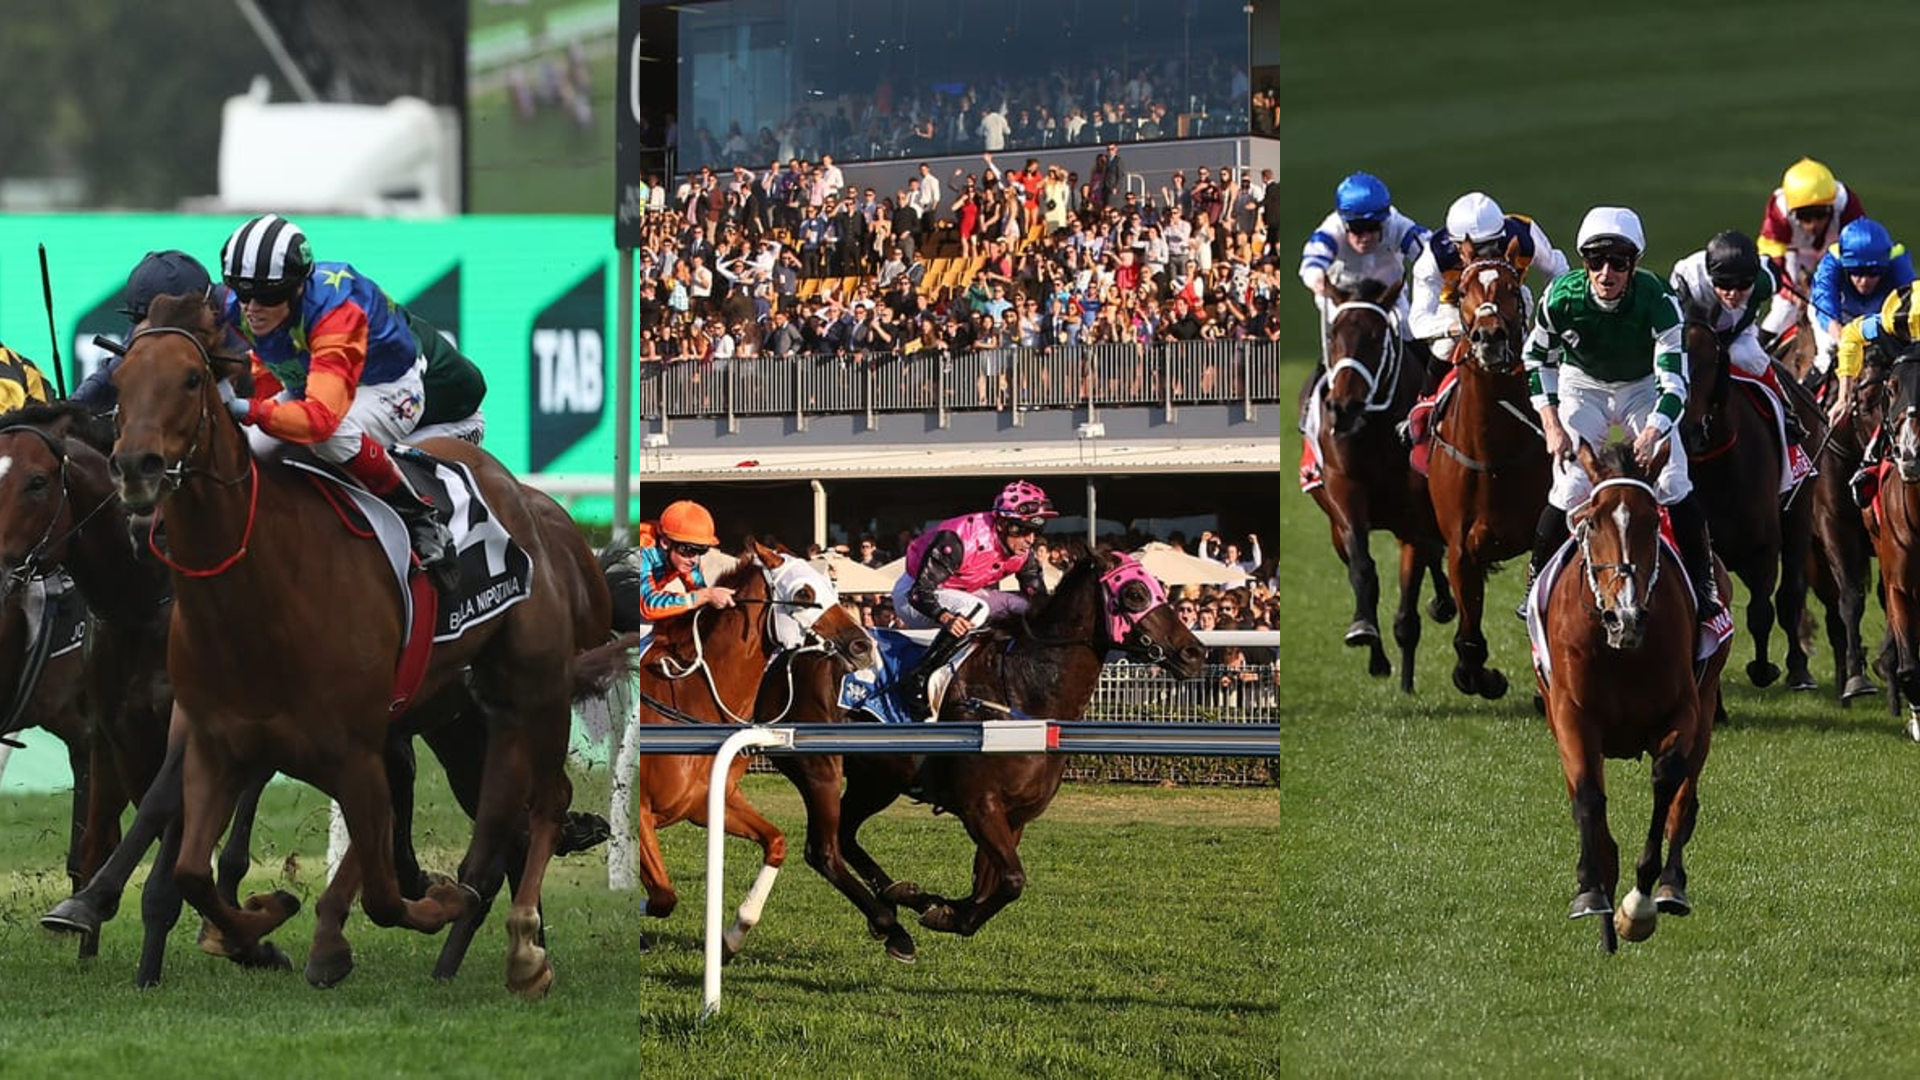
Australia is a racing nation of eight separate jurisdictions, made up of the six states and two territories under which racing is separately governed and administrated.
Itâs a model not without its problems, politics chief among them, but which allows each state to facilitate its own funding, impose its own administration and plot its own direction, quite literally.
That Australia could not come up with a common agreement of whether to race clockwise or anti-clockwise is sometimes used as an argument against the federated model, but racing existed long before federation in 1901, and the legacy of those times persists.
However, while horses, jockeys, trainers and breeders are free to cross borders, then the sense of national unity, and interstate rivalry, will remain.
Racing Australia is charged with being the closest thing to a national body, and while it has its limitations, it does produce an annual document which gives the best picture of the national trend of the industry. This week it released the Racing Australia Fact Book for the 2023/24 racing season.

It splits up the contribution of the states and territories to a host of key areas, although curiously in this yearâs edition, overall wagering, arguably the most important metric, has been left out.
It wonât surprise anyone that New South Wales dominates the national statistics in almost every category. In fact of the 19 categories we looked at, New South Wales was the leader in 12 of them.
It has the most clubs, most tracks, most meetings, most races, most active runners, most starters, highest overall returns, highest return per runner, most jockeys, stallions, mares and foals.
It trails Victoria in number of Group 1 races (although that could change this season), number of stakes races, ratio of stakes races to races, bookmakers, trainers and owners.
South Australia is the only other state to lead a category. It has the highest average field size of 10.29. Second on that scale is Western Australia (9.79), with Victoria third (9.68) and Tasmania fourth (9.55). New South Wales is fifth on 9.48.
New South Walesâ average starters has been on the slide for five years now, from 9.86 in 2019/20 to 9.72 in 2020/21, 9.69 in 2021/22, then 9.67 and 9.63.
That statistic is often considered important when it comes to encouraging wagering. The overall figure across Australia for 2023/24 was 9.51. That was an increase from the previous season when it was 9.42, while that figure was 9.41 in 2021/22 and 9.42 in 2020/21. The last time it was above the 9.5 mark was in 2019/20 when it was 9.63.
Average field sizes per state 2023/24:
New South Wales has long led the way on a couple of very fundamental statistics, the number of meetings held and the number of races staged. Last season there were 738 race meetings staged in New South Wales, 65 more than in Queensland and 201 more than Victoria.
In terms of races staged, NSW put on 5407, while Queensland had 4718 and Victoria 4333. Those three states make up more than three-quarters of the national racing schedule.
What is interesting is that while New South Wales staged 28.16 per cent of Australiaâs races, it paid out a 36.97 per cent of overall returns to owners, which includes prize money plus bonuses etc. Victoria made up 27.24% of returns, while Queensland was 17.75 per cent.
The average starter in New South Wales received $8160, a significant increase on Victoria where that figure stood at $7350. Western Australia was third on that list at $5308, ahead of Queensland on $4637.
While the cost of training horses varies by state, it is significant that the average starter in South Australia ($3968) and Tasmania ($3526) earned less than half of a starter in New South Wales.
While it trails NSW in most areas, Victoria still hosts the most stakes races of any state with 203, and the most Group 1 races, 30, one more than its northern neighbour. Overall, 4.68 per cent of Victorian races are stakes races, compared with 3.16 per cent as a national average. WA is second on this metric (3.67 per cent) while SA is third (3.32 per cent).
The opportunity to win a stakes race can be expressed by the percentage of black type events out against individual horses. In Victoria, this is 2.24 per cent compared to 1.64 per cent in New South Wales. The state with the highest ratio in this regard is WA with 2.38 per cent stakes races to active horse population.
Victoria is a dominant force when it comes to owners, with 36.05 per cent of the national total, or 49,182. New South Wales has 37,697, while Queensland has 22,382.
In terms of other participants, New South Wales has more jockeys than any other state, 251, compared to Queenslandâs 236.
But what is very interesting is that it is only third when it comes to registered trainers, with a total of 656. Of all the 19 metrics we compiled, it is the percentage of national trainers which is the lowest of all stats for New South Wales on 23.57 per cent.
Queensland, with its massive geographical spread, has the most trainers with 718, while Victoria has 668.
An approximate calculation of stable size can be made by dividing the number of active horses by the number of trainers. That stat shows the average in NSW, at 15.91, is substantially higher than both Victoria (13.55) and Queensland (10.67).
Aushorse Investorâs Guide 2025
- More Races worth $1 million+ than Europe & America combined
- More than 140,000 Australians involved in racehorse ownership
Victoria had the highest number of registered bookmakers, 103 to NSWâs 102, while Queensland had 83. Accounting for its massive corporate bookmaker presence, Northern Territory has 44.
Finally, we get to the breeding industry, where New South Wales completely dominates thanks largely to the position of the Hunter Valley as Australiaâs thoroughbred nursery. NSW has the highest number of stallions, active broodmares and the highest foal crop.
Overall, 33.2 per cent of Australian stallions stand in NSW, while it was 39.03 per cent of registered broodmares. The 2023 foal crop, conceived off 2022 coverings, saw 45.26 per cent of Australian foals born in NSW.
Victoriaâs numbers are broadly consistent across stallions, broodmares and foals in the 27 per cent range, while Queensland has 22.2 per cent of stallions, 16.68 per cent of broodmares but only 14.31 per cent of foals.
*All data sourced from Racing Australia Fact Book 2023/24

Racing in Australia by state and territory (2023/24)
Racing in Australia by state and territory as percentage of overall (2023/24)
*2022 conceived crop

