
Run The Numbers – A yearling market with bounce

While overall spending on Australian yearlings to this point of the sales season has dropped nearly $28 million compared to last year, the average price of a yearling is tracking to be the second highest on record. Run The Numbers takes the temperature of the market after Easter.
The jubilation for Inglis was clear after a highly successful Australian Easter Yearling Sale which featured the highest average price and third-highest gross in its illustrious history.
It followed on from a surprisingly strong Inglis Melbourne Premier Yearling Sale, which featured the third-highest average and fourth-highest aggregate in its history, and an Inglis Classic Sale which saw the fourth-highest average and sixth-biggest aggregate.
Having defied the gloom of the market to pretty much match last yearâs aggregate across the three sales ($265.4 million to $266.9 million) and increase the average of an Inglis-sold yearling to $179,950 in 2025 compared to $174.232 in 2024, Inglis had hit its own Triple Crown. It was cause for champagne for Mark Webster, Sebastian Hutch in the Inglis team.
The popping of corks at the Riverside Stables on Monday night may have seemed incongruous compared to the chaos enveloping the global economy, but if there were any troubles on the horizon for the bloodstock market, they were not in evidence across two days of selling which yielded over $150 million.
While there are still some yearling sales to come, the vast majority of trade in this crop of horses has been done with the completion of the Easter sale. There is certainly enough data to track year-on-year trends.
Overall yearling investment to this point of the season in Australia has been $527.3 million, that is $27.8 million, or 5 per cent less, than what it was to the same point last year ($555.1 million).
But the clear trend in the market is that the saving in overall amount has come in the form of a more selective market, rather than reducing the average price spent.
There have been 3407 yearlings purchased at public auction in Australia, which is 213 fewer than to this point of last sales season. Leaving out the pandemic-impacted 2020 season, it is the fewest amount of yearlings purchased at this point since 2017.
The result of that is that while the overall spend has declined the average price of a yearling has jumped to $154,772, or 0.9 per cent on what it was after the Easter sale last year ($153,356). That is the second-highest average at this stage of the season in history, behind only 2022, when it was $160,873.
To give some longer-term context, that figure in 2013 stood at $78,023. The average price of a yearling has doubled in that time. Horses and houses are different assets, but it is noteworthy that while the average yearling price has gone up 98 per cent, in 12 years the average price of a house in Sydney has increased 90 per cent in comparison.
Reacting to the selective market, the overall number of yearlings catalogued to this point of the season is 174 fewer than it was at this point in 2024. The Easter sale, with a catalogue of 421, was the most notable of these. Hutch said that there was no deliberate strategy to reduce the number of horses offered at Easter, that was just how selection fell. However, you could imply from that there was a higher threshold when it came to what made the catalogue.

Regardless of its genesis, as mentioned, that strategy worked in Inglisâ favour with Easter. It achieved a clearance rate of 86 per cent, which is extremely high in the current environment.
However, the broader trend is that the market has rejected more horses than it has in over a decade. There have been 809 yearlings passed in across Australia in 2025, 21 more than to the same point of last year and the most since 2013, when it stood at 893.
The overall clearance rate across the eight public auctions staged in Australia in 2025, three from Inglis and five from Magic Millions, stands at 80.8 per cent. Again, that is the lowest since 2013 and nearly nine percentage points down from what it was when the market was at its peak in 2022.
The most used word in describing the Australian yearling market over the past 18 months has been âpolarisedâ. Thatâs short code for saying that it is tough for sellers at the bottom end and buyers at the top end.
The averages of each of the Australian sales reflect this. To this point, Perth and Tasmania both had significant falls average, Adelaide and Classic had modest falls, Gold Coast January and Gold Coast March slight increases and Premier and Easter stronger increases.
Itâs a slightly different story when you chart the differences by overall spend. As mentioned, the overall aggregate spend was down $27.8 million.
The only sale to increase its aggregate spend was Melbourne, every other one was less than it was in 2024 and $21.9 million of that was on the Gold Coast in January, while Tasmania, Perth and Adelaide all experienced falls of more than $1 million.
Yearling sales results in public auction after conclusion of Easter sale since 2003
(2020 data includes Easter Round 2)
Â
Author

Related Articles
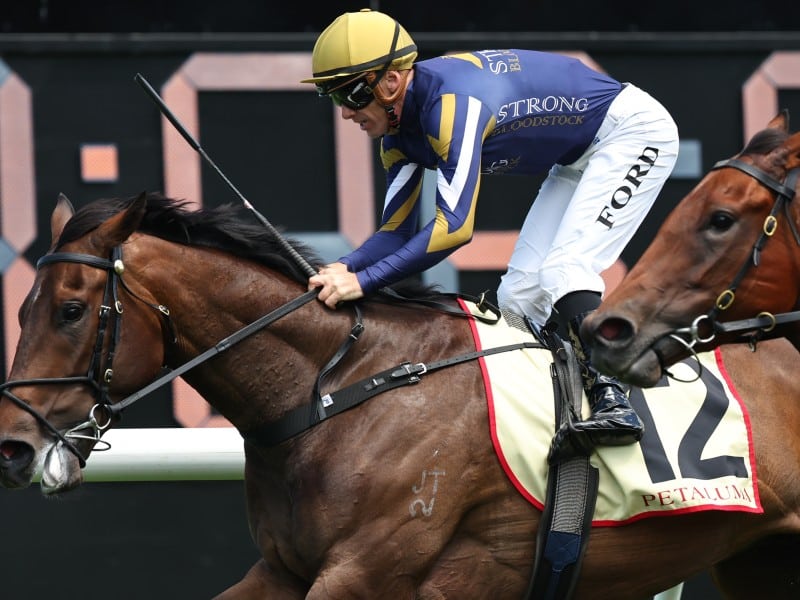
Kool runnings – Unbeaten 3YO flies flag for syndication minnow
As Ice Kool targets the $3 million Magic Millions Sunlight, the team at Strong Bloodstock is balancing racetrack ambition with yearling sale inspections and the realities of buying bloodstock on a budget.
The C word – Why the clearance rate on the Gold Coast will provide a window into the 2026 yearling market
Clearance rates don’t make sales companies rich, but they do tell a story. And in a market expected to remain selective in 2026, this statistic will be watched closely when Magic Millions launches the yearling sales season.

Walden to step back from WinStar role with Duffy to become CEO
Kentucky-based WinStar will figure in a change of leadership with Gerry Duffy to replace Elliott Walden as chief executive.